I still remember when I first heard the terms data analytics and big data applied to accounting. At that time, I thought accountants just worked with spreadsheets, journals, and ledgers. But those days are changing fast. Now, data analytics and big data are part of how I — and many accountants — work every day. In this article, I’ll walk you through how accountants use analytical tools to turn large volumes of financial data into clear, actionable business insights that support strategic decision-making.
What Are “Data Analytics” and “Big Data”?
Before we dive deep, let me explain in simple terms what I mean by data analytics and big data, especially in the world of accounting.
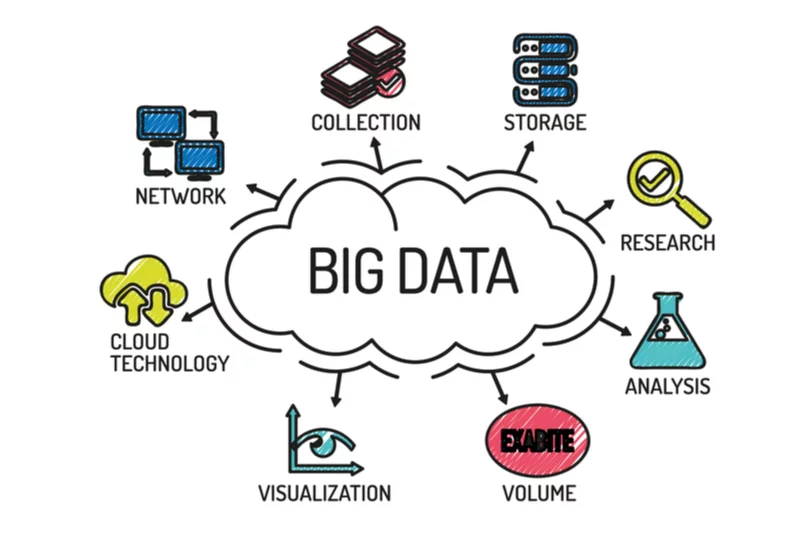
- Big Data refers to extremely large sets of data that come in many types (numbers, text, images) and arrive at high speed. The classic three “V’s” define big data: volume (lots of data), velocity (fast incoming data), and variety (different kinds). ResearchGate+1
- Data Analytics is the process of examining, cleaning, modeling, and interpreting data to discover useful information, draw conclusions, and support decision-making. In accounting, this means using software and statistical or machine learning tools to find patterns, anomalies, trends, and insights in financial data. WPUNJ+2Franklin University+2
In my practice, data analytics and big data go hand in hand. The big data gives the raw material (massive volumes of financial and non-financial data), and analytics is how I turn it into insight.
Why Accountants Need Analytical Tools
When I explain this to non-accountants, I often say: these tools help me see more than the numbers. They help me understand the story behind the numbers. But concretely, here are major reasons why accountants are adopting analytical tools:
- From sample checks to full-population analysis
In traditional auditing or financial review, accountants often pick a sample of transactions to test. But analytical tools let me examine all transactions, spotting anomalies, outliers, or irregularities. This reduces the risk of missing something important. UNC Kenan-Flagler+2Journal of Accountancy+2 - Faster, more accurate reporting
With automation and analytical engines, I can produce financial reports more quickly and with fewer errors. Data cleansing, cross-checks, and validation become systematic. WPUNJ+2Fitchburg State University Online+2 - Risk detection and fraud prevention
Analytical tools can flag suspicious patterns in large datasets — for example, unusual payment amounts, duplicate invoices, or irregular account entries. This is a huge help in fraud detection and maintaining trust. Fitchburg State University Online+3Journal of Accountancy+3WPUNJ+3 - Better decision support
When leadership asks, “What should we do next year?” or “Which product line is underperforming?”, I can analyze past performance, forecast trends, and support strategic decision-making. Analytics gives me the evidence behind my advice. ResearchGate+3Lamar+3Fitchburg State University Online+3 - Efficiency gains & cost savings
By automating repetitive tasks (data entry, reconciliations, cross-checking) and using algorithms to handle bulk work, I save time and reduce manual errors. That lets me focus more on advisory work. WPUNJ+2Fitchburg State University Online+2 - Enhanced client value & differentiation
In accounting firms, those who use analytics can offer more strategic services to clients — beyond just “bookkeeping and taxes.” This builds loyalty and competitiveness. Fitchburg State University Online+2Fitchburg State University Online+2
So in my own work, I see analytical tools not as a luxury, but as essential. Without them, we risk falling behind.
The Workflow: How I Turn Big Data into Insight
Let me walk you, step by step, through how I use analytical tools in practice — how I move from raw data to insight. The workflow typically involves these phases:

- Data gathering & ingestion
I collect data from many sources: accounting systems, ERP systems, sales databases, bank systems, internal operations, even external data (market indices, economic data, competitor benchmarks). Big data often includes structured (tables) and unstructured (text, logs) data. ResearchGate+2ResearchGate+2 - Data cleaning, transformation & integration
This is often the most time-consuming step. I correct mistakes, remove duplicates, fill missing values, standardize formats, and merge datasets so they “speak the same language.” It’s essential — without clean data, your insights might be wrong. ResearchGate+2Centre for Business & Economic Research+2 - Exploratory data analysis (EDA)
Here, I explore, visualize, and test hypotheses. I draw charts, histograms, scatter plots, pivot tables, and compute basic statistics (mean, median, distribution). This helps me see patterns, correlations, and anomalies. WPUNJ+3ScienceDirect+3The CPA Journal+3 - Modeling, analytics & machine learning
Depending on the goal, I apply different types of analysis:- Descriptive analytics: I describe what happened (e.g. revenue growth trends, cost drivers).
- Diagnostic analytics: I try to explain why something happened — for example, cost increased due to supply chain expenses.
- Predictive analytics: I use statistical or machine learning models to forecast future values: e.g. forecast next quarter’s cash flow, or predict accounts receivable risk. The CPA Journal+3Lamar+3ResearchGate+3
- Prescriptive analytics: I go further and suggest what actions to take. For instance, “If we reduce cost of X by 10%, we maximize profit.”
- Anomaly detection: I use algorithms to detect outliers or suspicious transactions (fraud detection). Journal of Accountancy+2WPUNJ+2
- Visualization & reporting
After processing, I present results using dashboards, charts, heat maps, summary tables. Visualization helps executive teams and stakeholders see the insights clearly. I always include the keyphrase data analytics and big data in image alt texts (for SEO). For example:- alt = “Dashboard showing data analytics and big data in a financial report”
- alt = “Graph representing how data analytics and big data transform accounting insights”
- Insight interpretation & storytelling
The numbers are only useful when interpreted. I translate findings into business language: “This product line is bleeding cash because its cost per unit rose 15%,” or “AR aging beyond 90 days is rising — we may need to tighten credit terms.” I also include scenario analysis (“What if?”) to advise decision-makers. - Monitoring, feedback & iteration
Insights should not be static. I monitor KPIs continuously, get feedback, adjust models, retrain if necessary, and revisit data. This turns accounting into a living, evolving function.
This cycle — ingest, clean, model, visualize, interpret, monitor — is how I turn raw data into usable business intelligence.
Real-World Uses & Examples
Let me share concrete examples (some from my own experience or from industry) where data analytics and big data change how accountants deliver value.
Example 1: Audit & continuous monitoring
In audits, instead of sampling 100 transactions, I may analyze 100,000+ transactions in real time. I can flag every instance where a credit entry equals a debit entry in a strange account, or detect duplicate invoices across months. This continuous auditing improves accuracy and reduces blind spots. UNC Kenan-Flagler+3Wikipedia+3Journal of Accountancy+3
Analytics also help auditors assess risk levels across business units: e.g. flag units with unusual expense patterns or revenue swings. Journal of Accountancy+1
Example 2: Revenue and cost trend forecasting
I once worked with a business where seasonal fluctuations masked underlying trends. By combining historical sales, external economic indicators, and cost-driver data, I built predictive models that forecast next year’s revenue and margin. Leadership used those insights to adjust their pricing, staffing, and inventory budgets.
Example 3: Fraud detection in expense reimbursements
A client suspected internal abuse of expense reimbursements. I used anomaly detection algorithms to scan thousands of expense entries. The model flagged entries that were significantly higher than norms, or entries in months when reimbursements were usually low. We uncovered a few fraud cases, and the company tightened its policy.
Example 4: Product profitability and customer segmentation
Another scenario: one company had multiple product lines, and leadership asked which were the most profitable, and which customers to focus on. I merged cost of goods, overhead allocation, customer purchase data, returns, and external market data. Using clustering and segmentation analysis, I identified underperforming products and high-value customer segments. That insight drove strategic marketing and investment decisions.
Example 5: Budget variance and early warning
I set up dashboards that compared actuals vs. budget in real time. When a metric deviated more than 10%, the system sent alerts. Management could then dive in early rather than discover problems at year-end.
These examples show how data analytics and big data support proactive, strategic accounting rather than reactive bookkeeping.
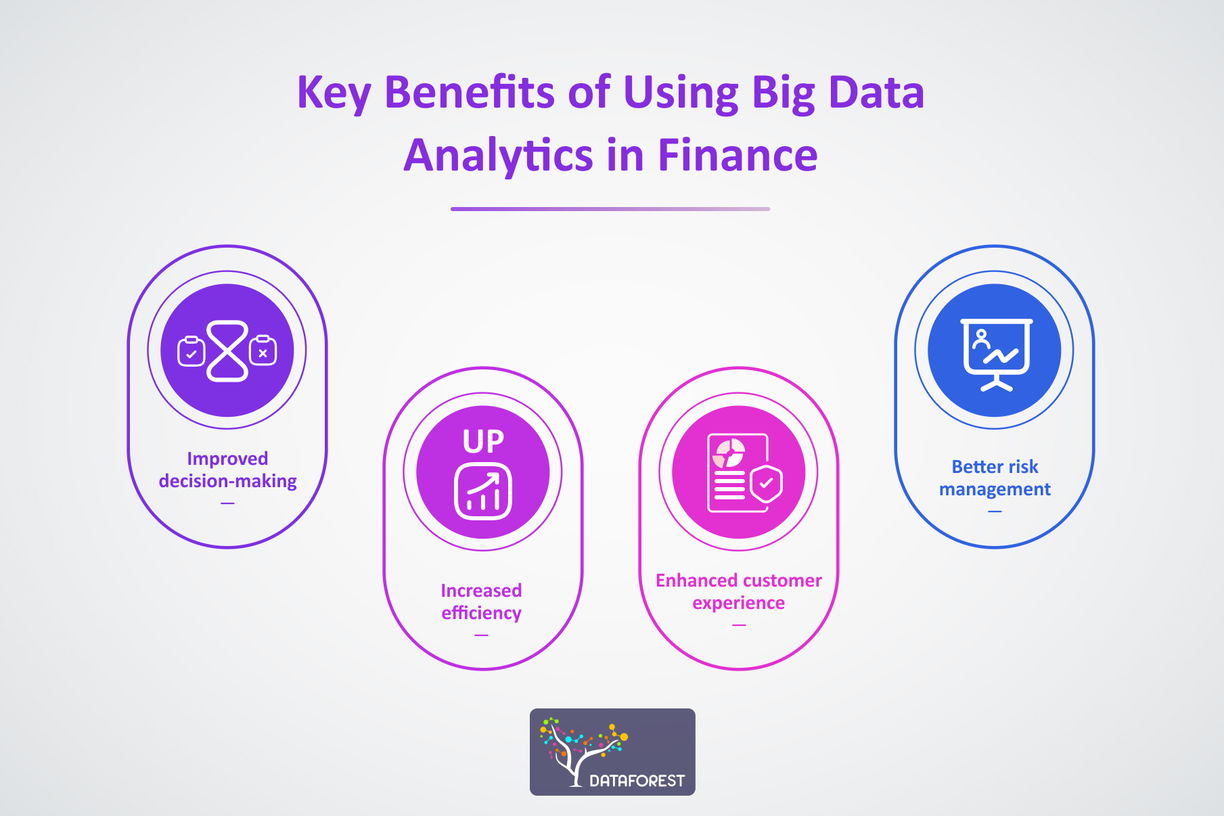
Benefits of Using Data Analytics & Big Data in Accounting
From my own experience and reading industry research, here are the biggest benefits I (and many accountants) see.

| Benefit | What It Means in Accounting |
|---|---|
| Increased accuracy | Less manual error, full population checks, better data validation |
| Deeper insights | Beyond financials — understand cost drivers, customer behavior, trends |
| Risk mitigation | Detect fraud, spot anomalies, forecast risks |
| Speed & efficiency | Automate tasks, faster reporting, fewer bottlenecks |
| Strategic advisory role | Move from number-keeper to trusted business partner |
| Client satisfaction & differentiation | Offer value-added services, retain clients |
| Real-time monitoring | Continuous auditing & dashboarding allow timely decisions |
Research backs this up. One study in Africa found that big data has a positive impact on financial reporting, performance management, budgeting, audit evidence, and risk management. ResearchGate Another review pointed out that big data and analytics help accountants improve the quality of accounting information and support real-time decision-making. Centre for Business & Economic Research Also, accounting firms report they can deliver more accurate, impactful services using analytics technologies. Fitchburg State University Online+2Fitchburg State University Online+2
Challenges & Risks I Face (and You Should Know)
It’s not all sunshine and rainbows. While data analytics and big data bring many advantages, I must navigate challenges. Here are the key ones:
1. Data quality, integrity & governance
As they say: “Garbage in, garbage out.” If data is wrong, analytics will mislead. I must enforce strict governance: who owns data, how it’s stored, who accesses it, version control, and audit trails. ResearchGate+2Fitchburg State University Online+2
2. Integration of disparate systems
Often, financial systems, CRM, inventory systems, HR systems don’t “talk” to each other or use different data formats. Merging them cleanly is laborious. ResearchGate+2Centre for Business & Economic Research+2
3. Talent & skills gap
Not all accountants are data scientists. I’ve had to learn new skills: SQL, Python, machine learning, visualization tools. Bridging that gap is time-consuming, but essential. ResearchGate+3The CPA Journal+3Fitchburg State University Online+3
4. Cost & technology investment
High-quality analytics platforms, cloud resources, and computational power can be expensive. Smaller firms might struggle with budget constraints.
5. Privacy, security & ethics
Dealing with sensitive financial data means I must ensure strict confidentiality, compliance with regulations (e.g. GDPR, data protection laws). Ethical use of models (avoiding bias, transparency) is also critical. ResearchGate+2Centre for Business & Economic Research+2
6. Model risk / overfitting
Sometimes models overfit (they perform well on training data but poorly on new data). I must validate and test models carefully. Also, assumptions behind analytics should be transparent, not “black box” mystery.
7. Change management & adoption
Even the best insights are useless if leadership doesn’t trust or use them. I need to present results in a way stakeholders understand and build trust gradually.
Understanding these challenges helps me mitigate them. But I don’t let them scare me away — I treat them as part of the journey.
Tools & Technologies I Use
What tools do I actually use in the real world to bring data analytics and big data to life in accounting? Here are some:
- Database / big data platforms: SQL, MySQL, PostgreSQL, NoSQL (e.g. MongoDB), Hadoop, Apache Spark (for distributed computing) ResearchGate
- ETL / data integration tools: Tools that extract, transform, and load data (e.g. Talend, Pentaho, Alteryx)
- Statistical / machine learning tools: Python (pandas, scikit-learn), R, SAS, Weka
- Visualization & dashboarding: Power BI, Tableau, Qlik, Looker
- Analytics engines & frameworks: predictive modeling libraries, anomaly detection libraries, forecasting models
- Governance & metadata tools: data catalogs, version control systems
- Audit analytics tools: specialized audit software to test controls, run continuous monitoring, detect anomalies Journal of Accountancy+1
I tailor my stack based on the size of the organization, budget, and data volume.
My View: Why This Is a Game-Changer
Let me share my reflections and viewpoint on why data analytics and big data are transforming accounting:
- Accounting is shifting from backward-looking to forward-looking. In the old days, accounting focused on recording what already happened. Now, thanks to analytics, I can help organizations anticipate and react to what might happen.
- Accountants become strategic advisors. With analytical insight, I’m not just number-recorder — I contribute to business strategy, performance improvement, cost optimization, forecasting, and risk planning.
- Smarter business decisions. Leaders often must decide under uncertainty. Analytics gives them evidence, simulations, and risk assessments.
- Culture change. Embracing analytics requires accountants and business leaders to trust data, rethink intuition, and adopt iterative experimentation.
- Democratization of insights. With dashboards and visual tools, insights are accessible to non-technical stakeholders. The barrier between numbers and decision-makers gets smaller.
I believe that accountants who don’t adopt analytics risk becoming commoditized, viewed as mere transactional operators. Those who embrace analytics become indispensable strategic partners.
Tips for Accountants Getting Started
If you’re an accountant (or aspiring to be one) and want to adopt data analytics and big data, here are some tips I’d give from experience:
- Start small, pick a pilot project
Don’t try to do everything at once. Pick a manageable project: maybe forecasting sales for one product line, or analyzing expense reimbursements. - Ensure data cleaning & governance
Before modeling, invest time in structuring good data pipelines, agreements on definitions, version control, and audit trails. - Learn tools gradually
Start with familiar tools (Excel + Power BI) and slowly move to Python, R, or ML. Use online courses or certifications. - Collaborate with IT / data engineers
You don’t have to do it alone. Partner with data engineers to set up infrastructure, pipelines, and architecture. - Communicate insights clearly
Use storytelling and visuals. Don’t just show a regression coefficient — explain that “if cost X increases by 1%, profit falls by Y%.” - Validate and test your models
Always hold out a test set. Check out-of-sample performance. Don’t overfit. - Get buy-in from leadership
Show early wins, ROI, and how analytics drives better decisions. Use those to scale adoption. - Keep iterating
Analytics is not “done once.” Models age. Business changes. Keep refining. - Pay attention to ethics & privacy
Use anonymization, encryption, access controls. Be transparent about how you use data. - Stay current on trends
Analytics, AI, machine learning evolve fast. Stay curious and keep learning.
What the Future Might Hold
Looking ahead, here are a few trends I expect in the intersection of accounting, data analytics, and big data:
- AI & advanced ML models
More accountants will rely on AI to build predictive and prescriptive models, anomaly detection, and even conversational assistants. - Federated / privacy-preserving learning
In audit or multi-client settings, models may be trained across clients without data being centralized — preserving privacy while learning from patterns. arXiv - Blockchain & triple-entry accounting
Some researchers envision new accounting models (like triple-entry) that combine with analytics for transparency and trust. arXiv - Embedded analytics
Analytical tools will be integrated directly into accounting and ERP software, so insights appear in everyday workflows. - Real-time continuous accounting & audit
Instead of monthly or quarterly reports, reporting and auditing will become continuous and real-time. Wikipedia+2The CPA Journal+2 - More specialization
Accountants will specialize in particular business domains — e.g. forensic analytics, sustainability metrics, ESG analytics. - Stronger regulation & ethics frameworks
As analytics influence decision-making and influence compliance, regulators will require explainability, transparency, and auditability of models.
I’m excited by where this is going. It means accounting will be more intellectually challenging, and more central to business success.
Conclusion: My Experience & Advice
To sum up, data analytics and big data are transforming accounting. I’ve walked you through definitions, why it matters, how I use tools in practice, examples, benefits, challenges, and future trends.
If there’s one thing I emphasize: insights are only useful when trusted and applied. As an accountant, your job isn’t just to build fancy models — it’s to interpret, advise, and embed those insights into decisions.
Also Read: “Shaping your accounting Firms“


